
Strength and conditioning coaches and Physiotherapists write training and rehab programs choosing various exercises. The choice of exercises depends on many aspects:
– Goals of the programme
– Movement patterns that need to be improved
– Muscle activation patterns of the chosen exercises
– Force production during the execution of the exercises
– Characteristics of the athlete/the sport/ the rehab needs for which they are writing the programme
Pretty much we can say that everyone prescribes a series of exercises for a reason, or at least, to try to obtain a specific goal. Despite this process seems pretty straight forward, it is surprising to find out how many times rehab or training programs are not based on sound progressions. Most of the times such planning mistakes are due to the fact that Force-Time patterns and/or muscle activation patterns of the exercises are unknown. This leads many times to inappropriate choice of exercise and/or inappropriate choice of progression. This problem is particularly acute when the athlete performing the training exercises prescribed is someone trying to recover from injuries.
In this simple article I want to introduce some simple concepts and some examples of how to critically analyse some exercises analysing Force-Time characteristics and muscle activation.
I promise to present more exercises in the next articles in order to provide hopefully some useful information for strength and conditioning specialists and physiotherapists.
I am going to use a simple setup for such descriptions. A Force platform measuring vertical ground reaction force, an electrogoniometer to measure angular displacement in key joints, a surface electromyography [EMG] system to measure muscle activity in key muscles. With this setup and all sensors synchronised I can analyse various exercises and provide a quantitative analysis of the forces produced, the timing of force production, the muscle activity and angular limitations.
The following is an example of data that can be obtained with such setup:

We have 3 charts:
– Force-Time Curve in blue
– Ankle-Time Curve in Purple
– Surface EMGrms activity of Tibialis anterior, soleus and gastrocnemius synchronised
The above data represent a recording of a counter movement jump. In point a the athlete is standing still and starts moving downwards flexing the knee joint, in point b the athlete has taken off, in point c, the athlete is landing.
Now, let’s look at the details:
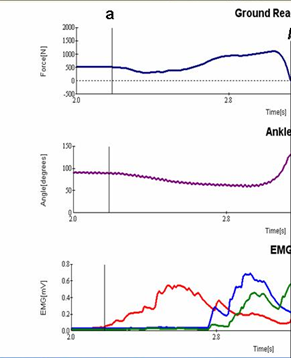
With this simple approach we can see how the peak force reaches values that are larger than 2 times the person’s body mass before take off. We can also see that the ankle contribution is limited to the last phase of take off. In terms of muscle activation patterns, tibialis anterior is very active during the downward phase of the counter movement jump, with soleus and gastrocnemius following similar patterns up until take off.
Looking at further details
Soleus and gastrocnemius EMGrms activity has a sharp rise in the moment of inversion of the movement, when the athlete starts to move upwards. Also, peak power output is reached way before full ankle plantarflexion is completed when taking off and also peak force is already reached.
The full movement lasts for 0.91s (from starting the movement downwards to take off).
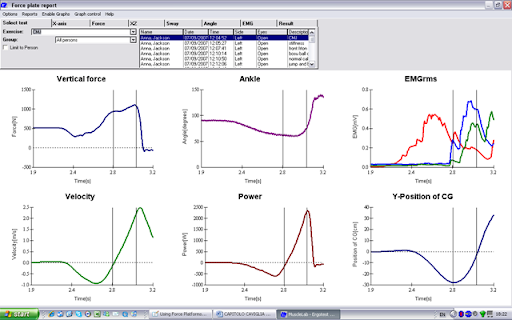
Let’s look at the landing phase now.

Ground reaction force (1st graph on the left) and rate of force development (RFD) are very high, actually higher than the force necessary to take off!
Muscle activation patterns are also peculiar, at landing all muscles around the ankle joint are activated in a similar pattern, with the gastrocnemius producing a larger EMGrms activity than the soleus.
So, how do we use this information in terms of exercise prescription? We know that CMJ type of jumps are requiring a force production larger than 2 times the person’s body mass, they require a production of force that lasts less than 1 second (of course the above parameters depend a lot on the quality of the athlete tested) and the plantar flexors contribution is limited.
What about landings? As we have seen in this example RFD and Peak ground reaction force are actually higher in landing from a CMJ as compared from taking off. So, if we want to use similar exercises in an athlete that has some issues with the Achilles tendon and/or muscles of the lower leg, we can still do so, making sure he/she is not landing. The obvious suggestion is then to do CMJs jumping onto a box and/or providing a very soft surface to land on in order to reduce force production and RFD.
I hope this makes sense. More to come in the next articles!

You must be logged in to post a comment.