Category: Injuries

High-volume injections for Achilles tendinopathy: no difference from sham at 12 months

Achilles tendinopathy is one of those conditions every sports medicine team knows too well. Around 6% of people will have it at some point in their lives, 38% of workers affected report reduced work capacity, and exercise-based rehabilitation, the recommended first-line treatment, does not resolve the problem in up to 44% of cases. While I personally solved such issues always with resistance exercise, almost half of those with persistent symptoms go on to seek other treatments, and injections are a common next step. One of the most popular over the last 15 years has been the high-volume injection: 50 mL of fluid pushed in between the tendon and the fat pad that sits in front of it, often with a corticosteroid added.

A randomised controlled trial just published in The BMJ by Peter Malliaras and colleagues, the Inject trial (28 October 2026), gives us the best data so far on whether these injections work. The headline is clear: at 12 months there was no difference between treatments. Neither the high-volume injection with corticosteroid nor the one without it improved pain and disability compared with a sham injection, and the two injections did not differ from each other.

What the trial did

The team randomised 192 adults with midportion Achilles tendinopathy at a radiology clinic in Melbourne between December 2019 and July 2022, recruited mainly through paid social media advertising and referrals from local doctors and physiotherapists. These were not mild cases: mean age 49, 55% men, a median symptom duration of two years, a baseline VISA-A score of 48.7 out of 100, about half with symptoms in both legs and a third with obesity. Everyone had pain for at least three months, ultrasound evidence of tendon pathology (hypoechoic areas and/or Doppler signal), and had not responded to previous treatment; almost 80% had already tried exercise.

Participants were randomised 1:1:1 to one of three arms:

  • Sham injection (n = 64)
  • High-volume injection without corticosteroid (n = 63)
  • High-volume injection with corticosteroid (n = 65)

Crucially, everyone then received the same care from a physiotherapist: a progressive 12-week calf and Achilles loading programme, education on activity modification using a pain-monitoring model, and information about the condition and its prognosis. So the question the trial answers is not “injection versus nothing” but “does adding an injection to good rehabilitation make a difference?”. Adherence was high, with 91–95% of participants averaging at least two exercise sessions a week across groups.

The primary outcome was the VISA-A (Victorian Institute of Sport Assessment – Achilles, 0–100, higher is better) at 52 weeks, and the trial was powered to detect a 10-point difference between any two groups. Because there were three pairwise comparisons, the authors used 98.33% confidence intervals and a significance threshold of 0.0167. A full cost-utility analysis from a societal perspective ran alongside, and the statistical analysis plan was published before any analysis started.

The injections, explained

The high-volume injection was introduced by Otto Chan and colleagues in 2008. Its rationale is that part of the pain in Achilles tendinopathy comes from new blood vessels and nerves growing into the front of the tendon from Kager’s fat pad, the triangle of fat between the Achilles, the deep flexor tendons and the heel bone. Injecting a large volume of fluid exactly at that interface is thought to disrupt this neurovascular ingrowth mechanically or by temporarily reducing blood supply, while a corticosteroid, when added, provides an anti-inflammatory effect.

Each participant received a single injection, under ultrasound guidance, from one of three experienced musculoskeletal radiologists, with the patient lying face down. Dr Chan himself travelled to Melbourne to train the radiologists, and 11% of injections were randomly observed to check fidelity. In practice:

  • High-volume injection with corticosteroid: five 10 mL syringes connected in sequence through a tube. The first contained 10 mL of 0.5% bupivacaine (a local anaesthetic) with 25 mg of hydrocortisone, followed by four syringes of 10 mL normal saline, for a total of 50 mL. The needle was placed at the interface between Kager’s fat pad and the tendon and moved gently along it, under continuous ultrasound monitoring, to spread the fluid evenly over the pathological area.
  • High-volume injection without corticosteroid: identical, except the first syringe contained only the 10 mL of bupivacaine.
  • Sham injection: 2–3 mL of 0.5% bupivacaine, injected at least 10 mm anterior to (deeper than) the fat pad–tendon interface, a placement unlikely to be therapeutic. It produces a numbing effect similar to the high-volume injections.

The masking procedures are worth noting. Every participant went through an identical procedure with five 10 mL syringes. In the sham group, a three-way stopcock diverted the fluid to a hidden bag. The syringes were taped so the colour of the steroid could not be seen, and afterwards participants wore a sleeve over the Achilles to hide any swelling from the large volume. The radiologists knew whether they were giving an active or a sham injection, but not whether the active one contained steroid. The check worked: immediately after the injection, 67–73% of participants in each group were unsure what they had received, and only 22–24% in each group believed they had received an active injection.
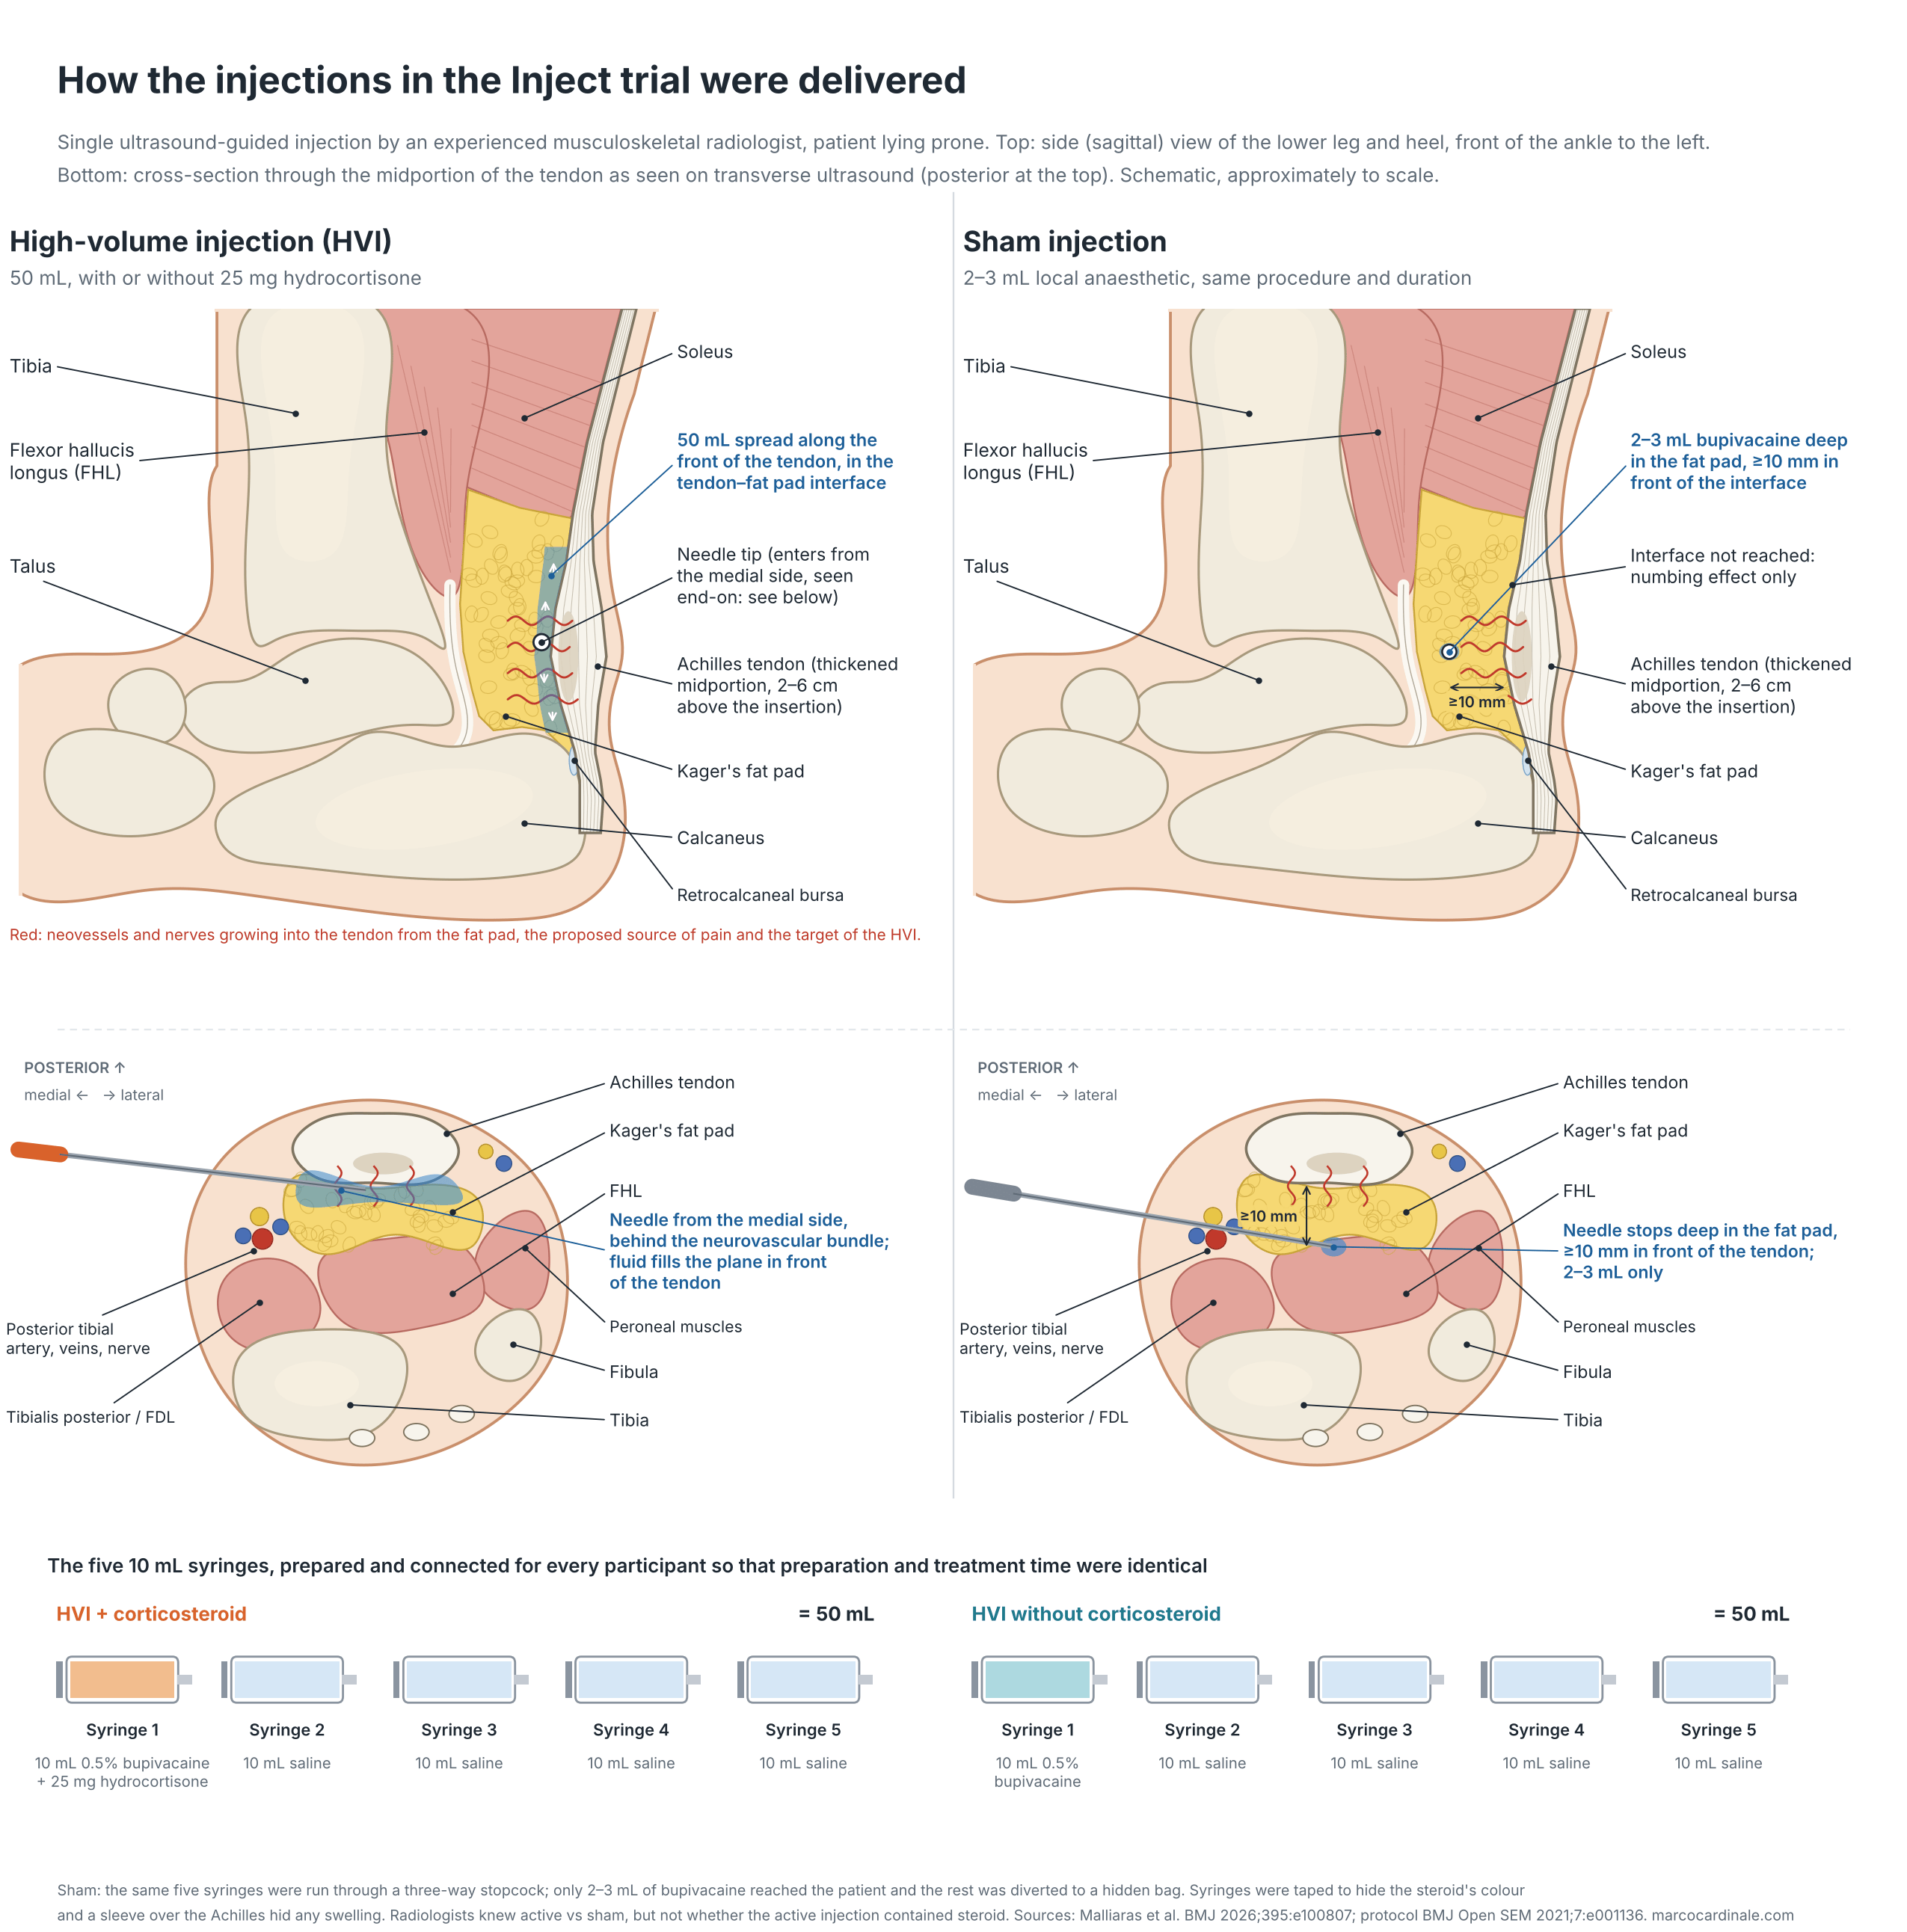
Schematic of the high-volume and sham injections used in the Inject trial: side view and ultrasound cross-section of the Achilles tendon and Kager's fat pad, needle position, and the contents of the five syringes
How the injections were delivered: side view, ultrasound cross-section and syringe contents (schematic; click to enlarge).

What each ingredient does

Bupivacaine is a long-acting local anaesthetic. It blocks voltage-gated sodium channels in nerve fibres, so pain signals cannot be transmitted. Its peak effect comes after about 30–45 minutes and the numbness lasts hours, not weeks. In the trial it gave the same numbing sensation in all three arms, which is part of what kept participants unaware of their group. The 50 mg used in the high-volume injections is well below the usual maximum dose of about 2 mg/kg (up to 175 mg), and the sham delivered 10–15 mg.

Hydrocortisone is a corticosteroid. It diffuses into cells, binds the glucocorticoid receptor and switches genes off and on in the nucleus: it dampens the NF-κB-driven production of inflammatory cytokines and COX-2, and increases annexin A1, which blocks phospholipase A2 and therefore the production of prostaglandins and leukotrienes. The net result is less inflammation, less vascular leakage and less pain sensitisation. The same actions have a cost in tendon tissue: injected corticosteroids reduce local collagen production, which can limit healing and leave the tendon more prone to failure. Hydrocortisone is short-acting and the least potent of the injectable steroids: 25 mg is equivalent to about 5 mg of triamcinolone, compared with the 40 mg typically injected into a large joint. Because tendinopathy is thought to be more a failed healing response than classic inflammation, damping that response can ease pain early without rebuilding the tendon.

Saline provides the volume: 40 mL meant to separate the tendon from the fat pad and disrupt the neovessels and nerves, mechanically or by cutting their blood supply. In Inject, the steroid-free injection made no difference to symptoms, Doppler signal or tendon thickness, so the volume on its own seems to be inactive.

Infographic on how bupivacaine, hydrocortisone and saline in a high-volume injection work, with the benefits, local and systemic side effects, groups needing extra care and contraindications for corticosteroid injections
How the drugs in a high-volume injection work, and the benefits and risks of corticosteroid injections (click to enlarge).

What they found: no difference between treatments

Follow-up was excellent, with VISA-A data from 181 of 192 participants (94%) at 12 months. At the primary endpoint there was no difference between any of the groups:

  • High-volume injection with corticosteroid vs sham: −3.5 points (98.33% CI −12.0 to 5.0)
  • High-volume injection without corticosteroid vs sham: +4.0 points (−4.2 to 12.3)
  • With vs without corticosteroid: −7.5 points (−15.3 to 0.3)

The high-volume injection without steroid showed no benefit over sham at any time point, on VISA-A or on any secondary outcome. Ultrasound told the same story: there were no differences in Doppler signal or tendon thickness between this injection and sham. As the authors put it, simply injecting a volume of fluid does not seem to affect tendon pathology or improve clinical outcomes.

The secondary time points showed a pattern worth knowing about, but it needs to be read with caution. With the steroid injection there was a small benefit over sham at six weeks (+9.2 points, 1.5 to 16.9), together with a better global rating of change. By 26 weeks the steroid group was doing worse than the group that had received the same injection without steroid (−8.6 points, −16.4 to −0.7), with higher worst pain over the previous week (11.3 points on a 0–100 scale). All of these differences were smaller than the 10-point target, and the authors note that the early benefit is unlikely to be clinically meaningful and might be no more than chance, given the number of outcomes and time points tested.

Forest plot of between-group differences in VISA-A at 6, 26 and 52 weeks in the Inject trial, showing no difference between treatments at 12 months
Between-group differences in VISA-A with 98.33% confidence intervals.

Benefits and risks of these injections

Benefits. The case for a corticosteroid-containing injection rests on short-term relief. In the Inject trial this was a 9.2-point VISA-A advantage over sham at six weeks, smaller than the 10-point target and gone by 12 months, along with less time off work early on and lower costs over the year. The procedure is quick, done in one visit and image-guided. The steroid-free injection showed no benefit at any point.

Risks in the trial. There were no Achilles tendon ruptures. Six participants had serious adverse events (two in each group), none related to the trial. Non-serious adverse events were common in all groups (53% sham, 38% without steroid, 49% with steroid), mostly aggravated Achilles pain (28%, 16% and 25%) or other musculoskeletal pain. Only one, injection-site pain after the steroid injection, was judged to be related to the injection itself. The main harm signal was clinical rather than a complication: worse VISA-A and worse pain at 26 weeks with the steroid than without it.

Risks of corticosteroid injections in general. A 2024 review in the American Journal of Roentgenology by Kamel, Rosas and Gorbachova sets out the side effects patients should be told about before a musculoskeletal steroid injection. It also notes that systematic reviews are inconclusive on long-term benefit for joints and tendinopathy, which fits the Inject results. Most of the frequencies below come from mixed injection sites, often joints, rather than from Achilles injections specifically:

  • Local: a post-injection flare of pain is common, reported in 33–35% of hand, wrist and shoulder injections, usually starting 1–2 days later and lasting about 2 days. Skin thinning or loss of colour occurs in up to 10% after superficial injections (for example of the plantar fascia), appears within months and usually resolves within a year. Tendon rupture is rare, about 0.1%, typically between 2 days and 6 weeks after the injection, and the Achilles is one of the tendons involved in case reports. Being next to the tendon rather than in it is not a guarantee of safety: in a rabbit study, injection into the retrocalcaneal bursa weakened the Achilles as much as injection into the tendon. Infection after a joint injection is very rare (under 0.001%), and soft-tissue calcification, faster progression of osteoarthritis and bone injury have also been reported, mainly after joint injections.
  • Systemic: part of the injected steroid reaches the bloodstream. Cortisol production is suppressed for at least a week after a single injection, and for up to 2 weeks in a study of young athletes. Facial flushing affects about 40% and settles within 3 days. Blood pressure and blood glucose can rise for more than a week. About half of premenopausal women have early or delayed periods afterwards. Allergic reactions (0.3–0.5%), raised eye pressure, insomnia, headache and, with repeated use, bone loss are also described.
  • People with diabetes: glucose typically peaks 1–3 days after the injection, and levels up to 500 mg/dL have been reported. The review cites a recommendation to check glucose twice a day for a week, seek help above 360 mg/dL, and avoid injecting if fasting glucose is above 200–250 mg/dL.
  • Surgery: injections are linked to more post-operative infections and to more revision surgery after tendon repair. The review suggests delaying surgery for 1–3 months after an injection and withholding steroid for 3–6 months before a tendon repair or joint replacement.
  • When not to inject: absolute contraindications are infection at the needle site, septic arthritis or osteomyelitis, fracture and a prosthetic joint. Relative ones include the HIV drug ritonavir, surgery planned within 4 weeks, previous blurred vision with steroids, very high blood glucose and a previous allergic reaction. There are still no evidence-based limits on how often or how many times these injections can be given; specialty societies suggest at least 3 months between injections, and some authors suggest no more than 3–5 at a single site.
  • Athletes: an International Olympic Committee consensus statement says corticosteroid injections are not indicated for same-day return to play or within 72 hours of competition, because of the risk of tendon weakening, and the review advises avoiding vigorous activity for at least 48 hours after an injection, partly because of the temporary adrenal suppression. Under the WADA rules, glucocorticoids given by any injectable route are prohibited in competition and washout periods apply, so athletes need to check timing with their anti-doping organisation and, where needed, apply for a Therapeutic Use Exemption.

The local anaesthetic is not entirely innocent either. Its toxicity to cartilage depends on dose and exposure time, it appears to add to the toxicity of the steroid when the two are combined, and animal studies suggest a similar additive effect on tendon cells. A systematic review cited by the AJR authors found bupivacaine at 0.5% or higher, the concentration used in the Inject trial, to be the most toxic to human cartilage in the lab, although what this means at the doses used in a single injection is still poorly understood. Accidental injection into a blood vessel can also cause systemic toxicity, one more reason these procedures are done under image guidance.

The cost paradox

The health economic analysis adds a twist. Over a year, the steroid injection was less costly than sham from a societal perspective, with similar quality-adjusted life years, and had a more than 90% probability of being cost-effective at willingness-to-pay thresholds of AUD 50,000 and 100,000. The saving came from less time off work in the first 12 weeks and lower healthcare costs in the last six months. The injection without steroid had a low probability of being cost-effective (under 60%). The authors are cautious (and rightly so!), though: the QALY differences were very small and the health benefit negligible, so this is a modest economic signal rather than a clinical argument for the injection.

How I read it

For me, this is a very well-designed trial and an important one. A few things stand out.

The primary answer is no difference. Adding a high-volume injection, with or without steroid, to a good rehabilitation programme did not change pain and function at one year. That is the result that should guide practice, and the secondary findings do not change it.

The volume is not the active ingredient. The steroid-free injection tests the mechanical “break the neovessels” idea on its own, and it did nothing measurable to symptoms or to the tendon on ultrasound. This agrees with the 2020 BMJ trial by van der Vlist and colleagues, which also found no benefit of the steroid-free injection over sham up to 26 weeks; Inject extends that to 12 months. Earlier positive results came from much smaller trials by Boesen and colleagues (2017 and 2019); for the 2019 trial of 28 people, the Inject authors point out that the small sample raises concerns about overestimated effects and that using saline as the sham may have compromised masking.

Any steroid effect follows a familiar pattern. A possible small, short-lived benefit followed by worse outcomes later is what we have seen with corticosteroid injections in other tendinopathies, particularly lateral elbow. Here it was seen with a low dose (25 mg hydrocortisone) delivered around, not into, the tendon. In his accompanying editorial, John Orchard (University of Sydney) makes the practical point that corticosteroids are neither uniformly good nor uniformly bad: their use depends on whether short-term needs outweigh longer-term ones, patients should never be told an injection will “fix” tendinopathy, and clinicians need to explain that trade-off. The authors give a similar example: a self-employed person under financial pressure may reasonably value a few pain-free weeks.

The authors’ own prior beliefs make the result more convincing. One author is a radiologist working in a clinic that offers high-volume injections, and two physiotherapist authors, including the lead author, declare that they have recommended the injection in the past. Running a trial with a well-designed sham, publishing the analysis plan first, sharing the data and code openly, and then reporting a null result is exactly how it should be done, so kudos to the authors.

Rehabilitation that includes resistance exercise remains the backbone. Every participant received the same structured loading programme and education. The time and effort should go into well-dosed, progressive tendon loading, load management and patient education rather than into injections.

Limitations worth keeping in mind

  • It is a single-centre trial and participants were recruited mainly through social media, so they may not represent people seeking care in hospital or clinic settings.
  • The nurse and radiologists delivering the injections could not be masked, although they followed a scripted protocol to limit any influence.
  • With many outcomes and time points, some of the secondary findings could reflect chance rather than true effects.
  • Only the VISA-A was used from the four instruments in the newer core outcome set for Achilles tendinopathy, COVID-19 restrictions increased missing imaging and strength data, and adverse events and costs were self-reported every six weeks, which may be subject to recall bias.
  • Half the participants had symptoms on both sides but only the worse side was injected.
  • The population was middle-aged with long-standing symptoms. Whether the results apply equally to younger, high-level athletes with a shorter history is not known.

Bottom line

There was no difference between treatments at 12 months: high-volume injections, with or without corticosteroid, are no better than a sham injection when added to good rehabilitation for midportion Achilles tendinopathy. The steroid version may give a small, short-lived benefit at six weeks but is followed by worse outcomes than the steroid-free injection at six months. In the authors’ words, the evidence “should prompt clinicians to reconsider the rationale for using these injections in people with Achilles tendinopathy”, and the clinical data do not support routine use.

Infographic summarising the Inject trial: no difference between treatments at 12 months, with participants, the three injection arms, secondary findings, costs and safety
The Inject trial at a glance (click to enlarge).

Reference: Malliaras P, Connell D, Boesen AP, Kearney RS, Menz HB, Morrissey D, Munteanu SE, Silbernagel KG, Underwood M, Forbes A, Haines TP. Efficacy and cost effectiveness of high volume injections with and without corticosteroid compared with sham for midportion Achilles tendinopathy (Inject trial): randomised controlled trial. BMJ 2026;395:e100807. https://doi.org/10.1136/bmj-2026-100807 (open access). Data and code: https://doi.org/10.26180/c.8671176.

Side effects review: Kamel SI, Rosas HG, Gorbachova T. Local and systemic side effects of corticosteroid injections for musculoskeletal indications. AJR 2024;222:e2330458. https://doi.org/10.2214/AJR.23.30458

Trial protocol: Malliaras P, et al. BMJ Open Sport & Exercise Medicine 2021;7:e001136. https://doi.org/10.1136/bmjsem-2021-001136. Trial registration: ACTRN12619001455156.

Rebuilding the Football Injury Dashboard: Adding Transfermarkt Data for the 2026/27 Season

The 2026/27 season is a few matchdays old, which is exactly the point in the calendar when injury counts start climbing. It seemed a good moment to go back to the European football injury dashboard I put together earlier in the year and deal with something that had been bothering me about it.

The original version had a structural weakness. Its month-by-month figures were not measurements. The Howden Group Men’s European Football Injury Index — the best free source covering the top five leagues — publishes one total per season, not one per month. To draw a monthly curve I had been distributing those annual totals across the year using the seasonal distribution reported in the UEFA Elite Club Injury Study. That gives a defensible shape, but every individual month was an artefact of the model rather than a count of anything. If you had asked the chart whether September 2023 was worse than September 2024, the answer would have been decided by the annual total, not by what happened in September.

So I added a second dataset alongside it, and let the reader choose which one they are looking at.

Two datasets, two different questions

The dashboard is here: footballinjuries.tiiny.site. A toggle at the top switches between the two sources. They answer genuinely different questions, and I have tried to make the distinction obvious rather than burying it in a footnote.

  • Season pattern — estimated monthly counts across seven leagues and five seasons, showing when in the year injuries cluster. Good for shape, approximate for magnitude.
  • Injured right now — a real count of every player listed as injured on a given date, from Transfermarkt. Good for who is actually missing, useless as a season total.
Line chart showing estimated monthly injury counts across seven European football leagues for the 2026/27 season, peaking in September
The seasonal view. The September peak is the most consistent feature in the whole dataset — players return from the summer break, fixtures arrive quickly, and bodies that have not been at match intensity for weeks are asked to perform. A second, smaller rise comes in April as accumulated load tells.

The Transfermarkt layer

The new view collects every player listed as injured on Transfermarkt‘s injury pages for the Premier League, Bundesliga, La Liga, Serie A, Ligue 1, Eredivisie and Liga Portugal. On 28 August 2026 that came to 257 players. These are individual records — a named player, his club, and what is reported to be wrong with him — not a figure derived from anything.

Stacked bar chart showing players currently injured across seven European leagues on 28 August 2026, coloured by injury type
Players injured across the seven leagues on 28 August 2026. You can click into any league to see it club by club.

The Bundesliga stands out with 66 players out, against 15 in Ligue 1 — though before reading anything into that, note that squad sizes, fixture load and how much press attention a league receives all feed into these numbers. That last factor matters more than it might appear, and it leads directly to the caveats.

Where this data is weak, and why I have said so on the page

Transfermarkt injury records are compiled from press reports, not club medical records, and that has consequences worth stating plainly.

A snapshot over-represents severe injuries. A cruciate ligament rupture stays visible on the page for months; a grade one hamstring strain disappears within a fortnight. The injury mix in the chart is therefore more severe than the mix of injuries a league actually sustains. This is straightforward survivorship bias and it cannot be corrected without incidence data.

Roughly a third of records name only a body part. “Knee injury”, “ankle problems”, or simply “unknown injury”. I could have forced these into a category and produced a tidier chart, but that would be inventing precision that is not in the source. They appear as Not specified instead. In the Eredivisie this accounts for 32 of 56 records — a striking difference in reporting practice rather than in injury patterns, and one that is itself interesting.

These are counts, not rates. There is no exposure denominator — no adjustment for minutes played — so none of this is comparable with the injuries-per-1000-hours figures the epidemiological literature reports. For that you need the UEFA Elite Club Injury Study or club data, and this dashboard is not a substitute for either.

The Eredivisie and Liga Portugal are also absent from the Howden report entirely, so their seasonal estimates lean on published injury-rate research for comparable leagues and should be treated as softer than the other five.

Other changes

Two smaller things. The dashboard is now written for a general reader rather than for me — plain-language injury categories, an explainer at the top, and a summary underneath the chart that rewrites itself as you change the selection. It also now states honestly how solid each season is: 2022/23 to 2024/25 are confirmed by Howden, 2025/26 has finished but is awaiting the December 2026 report, and 2026/27 has barely started and is labelled as a projection rather than a record.

The other change is invisible but was the reason several people saw a blank page: the chart previously loaded its plotting library from a CDN, and if that request failed — restricted network, content blocker, poor connection — the result was an empty rectangle with no explanation. It now draws its own SVG with no external dependencies at all. Nothing is loaded from anywhere. It works offline.

What next

The obvious next step is real month-by-month history rather than estimates. Transfermarkt does hold this — every individual injury record carries a start date — but assembling it means collecting player-level histories across seven leagues and several seasons, which is an overnight job rather than a page fetch. I have the pipeline written using the worldfootballR package; it is a matter of running it and validating what comes back. If it holds up, the estimated monthly figures get replaced with counted ones and the weakness I described at the top of this post disappears.

As with the triathlon dashboard, this is a living project and I would rather it be scrutinised than taken on trust. Have a look at the dashboard and tell me what is wrong with it, or what you would want to see next.

Seasonal estimates derived from the Howden Group Men’s European Football Injury Index (2024/25 edition, published December 2025) and the UEFA Elite Club Injury Study. Current-injury figures collected from Transfermarkt on 28 August 2026 and filtered to clubs competing in each league. Injury classification from free-text labels is approximate. These are counts without an exposure denominator and should not be read as incidence rates.

When FIFA Opened the Data: How the World Cup Is Changing the Way We Understand the Game

For most of my career, the richest data in elite football sat behind closed doors. Tracking systems, multi-camera optical feeds, possession context, off-the-ball movement — the kind of information that actually explains why a match unfolds the way it does — was the private property of a handful of federations and clubs wealthy enough to own it. Everyone else worked with shots, corners, fouls and possession percentage, and squinted to fill in the rest.

That is changing, and the FIFA World Cup has become the most visible stage for the shift. Over the last two tournaments FIFA has done something I think is genuinely important for our field: it has taken some of the most modern performance data ever produced in football and made a meaningful slice of it public. As someone who has spent years arguing that data only becomes knowledge when people are allowed to interrogate it, I find this exciting — so I wanted to write down where this data lives, who is doing interesting things with it, and why the act of sharing matters as much as the numbers themselves.

FIFA’s initiative: Enhanced Football Intelligence

The centrepiece is Enhanced Football Intelligence (EFI) — the set of metrics that first appeared as those small graphics in the corner of the screen during the 2022 World Cup. EFI was built by FIFA’s Football Performance Analysis & Insights team to move us beyond traditional counting stats and toward metrics that describe how a team plays.

What makes EFI different is its source. Rather than relying only on on-the-ball event data, it combines event data with live tracking data from every player on the pitch, captured by a multi-camera optical system. When something happens, you know where all twenty-two players were in relation to it. That positional context is what unlocks metrics you simply cannot derive from a traditional stats sheet, including:

  • Line breaks — how often a pass cuts through an entire defensive unit, and whether it went through, around or over. FIFA’s own analysis shows that the more line breaks a team concedes in midfield, the more games it tends to lose.
  • Ball recovery time — how long, on average, it takes a team to win the ball back after losing it.
  • “In contest” possession — the honest third category that sits between “our ball” and “their ball,” capturing the messy phases when nobody is truly in control.
  • Receptions behind the midfield and defensive lines — where and how players make themselves available between the opponent’s units.
  • Pressure on the ball and forced turnovers — whether a side is genuinely disrupting the opponent or merely looking busy.

Crucially, FIFA makes this available to the public. The metrics are explained — with video and multilingual PDFs — on the FIFA Training Centre, and snippets of match data are published after games. For the 2026 tournament FIFA has gone further still, layering on two new initiatives: the FIFA Power Rankings, an objective player-rating system scoring every outfield player 0–10 for attacking, creativity and defending using EFI algorithms; and FIFA AI Pro, which gives all 48 teams the same generative-AI tools to explore match data and rebuild moments in 3D — explicitly framed as democratising analytics that used to belong only to the biggest budgets.

Where to find the data and the people working with it

Here are the sites I’d point any coach, analyst or curious fan toward. I’ve grouped them deliberately, because one distinction matters a great deal and is easy to miss: some of these work directly from data officially published by FIFA, while others produce excellent World Cup analysis using third-party providers such as StatsBomb. All are worth your time — but knowing which is which keeps you honest about where a number actually came from.

The official source

FIFA Training Centre

This is the well from which everything else is drawn. Free, open, and aimed at coaches of every level, it hosts the EFI metric explainers, the “Football Language” glossary, video breakdowns, the FIFA Insight interviews with the people who built EFI, and — the part I’d flag for 2026 — the Match Report Hub, a live index of post-match summary reports for every World Cup match, organised by group and added as the tournament unfolds. If you only bookmark one link from this article, make it this one.

Working directly with FIFA’s published reports

Tactics Journal

The sharpest example I’ve seen of someone treating FIFA’s openness as a system rather than a curiosity. Tactics Journal points out that FIFA is publishing a roughly 52-page post-match summary for every group-stage game — formations, pressing phases, line-break tables player-by-player, defensive pressure maps, sprint-zone physical data — all in a consistent structure. Their argument is that because every report follows the same layout, you can parse all of them into a structured, auditable evidence layer for scouting and tournament-wide tactical questions. They call it “tactical infrastructure,” and I think that’s exactly the right way to think about it: the PDF is content; the structured layer you build from it is infrastructure.

EFI Data Reference

An independent blog that does something quietly useful: it organises and explains the EFI metrics as a reference, pulling together the definitions of phases of play, line heights, team lengths, receptions and the rest into one navigable place. A patient companion to the official material that helps a newcomer go from “what is a line break?” to actually reading a match through that lens.

Doğan Parlak’s open-source EFI implementation

My favourite example of why open methods matter as much as open data. Parlak built an open-source implementation of FIFA’s EFI metrics — data, concept and visualisation layers — with the explicit goal of reproducing FIFA’s match reports and testing whether the published concepts are specified well enough to be rebuilt by an outsider. That is science in the best sense: take the published method, try to recreate it, and flag the ambiguities. For analysts and students it doubles as a practical toolkit for generating EFI-style visualisations. You can read his Master’s thesis on this project here.

The wider analytics and data-journalism ecosystem

These don’t all run on FIFA’s own feed, but they show what a culture of shared football data makes possible — and they’re some of the most engaging World Cup analysis being published right now.

Northeastern Global News — NGN Offside / NetSI Sport

A blog “powered by data science and written by journalists,” produced by Northeastern’s Network Science Institute (the NetSI Sport group led by Brennan Klein). It’s a masterclass in turning event data into narrative: passing networks and passing-cluster maps that fingerprint a team’s style, xG shot maps, dribble-and-carry graphics, and genuinely novel angles like whether the 2026 hydration breaks are changing scoring patterns. Worth knowing that their underlying data comes from Hudl StatsBomb (over 3,400 events per match), not FIFA’s EFI feed — a good illustration of how the official and commercial data worlds sit side by side.

Datawrapper — Data Vis Dispatch

Not a football site at all, but a weekly roundup of the best data visualisations from newsrooms around the world, and during the tournament it’s been a reliable showcase of World Cup charts — qualification journeys, the evolution of the match ball, player and game analyses from the likes of Reuters, The New York Times and El País. The best place to see how professional data journalists choose to present this kind of information. Some details are also here.

Microsoft Fabric Community — FIFA World Cup 2026 Stats Analysis Hub

A reminder that you don’t need a newsroom to do this. This is a community-built interactive Power BI dashboard — one example aimed at World Cup Fantasy players, with a “Stat View” toggle to compare a player’s club versus international form before making transfer decisions — sitting within Fabric’s wider Data Stories Gallery of user-made World Cup dashboards. A nice window into the grassroots, build-it-yourself end of the spectrum.

(Two more worth a look in the same spirit: Tactical Football Analysis for written post-match tactical breakdowns, and Flourish, whose football chart templates are a quick way to build your own tournament visualisations.Also, have a look at this substack on how to build team-shape visualisations.)

What the analysis actually looks like

The reason this data is worth sharing is that it produces visuals that change how you see a match. A few of the workhorse formats:

  • Pass networks map who connects to whom and where, turning a team’s structure into a readable shape — you can see at a glance whether a side is building through its full-backs, overloading one flank, or bypassing midfield entirely.
  • Tracking heatmaps show where players and teams actually spend their time, exposing the difference between nominal position and real behaviour, and revealing how compact or stretched a side is in and out of possession.
  • xG (expected goals) shot maps put a probability on every chance so you can judge whether a team created genuine danger or simply accumulated low-value shots — useful, as long as you remember it’s a guide, not a verdict.

The principle underneath all of them is the same one I keep coming back to: the best statistics don’t make football more complicated, they make it easier to understand. A line-break count, a compactness number or a clean sprint map isn’t there to replace the coach’s eye — it’s there to sharpen the question the coach is already asking as well as providing additional information for support staff to improve how players are prepared.

The other half of the story: injuries and player health

It would be a strange omission, for me especially, to write about World Cup data and talk only about what happens when players are on the pitch. The same tournament that generates all this performance data also generates a great deal of information about the cost of playing it — and FIFA itself frames its data mission broadly, as unlocking the potential of video and data to drive technical development and education, not just tactical analysis.

This World Cup has put player load firmly in the spotlight. The expansion to 48 teams and 104 matches, layered on top of an already congested club calendar, has prompted warnings from sports-medicine specialists that fatigue and tight scheduling are pushing injury rates up — with the knee particularly exposed to the constant cutting, pivoting and rapid changes of direction the modern game demands. FIFA’s own venue medical staff have pointed to the injuries they see most often in elite players: ankle sprains, and hamstring and calf strains. None of that is new in kind, but the volume and the schedule are. At the end of each tournament there is always a published paper on the injury surveillance activities conducted by the FIFA medical team. If you want to read more about our experience at the FIFA 2022 World Cup you can read the following papers:

Serner A, Chamari K, Hassanmirzaei B, Moreira F, Bahr R, Massey A, Grimm K, Clarsen B, Tabben M. Time-loss injuries and illnesses at the FIFA world cup Qatar 2022. Sci Med Footb. 2025 Aug;9(3):275-282. doi: 10.1080/24733938.2024.2357568. Epub 2024 Jun 11. PMID: 38860817.

Schumacher YO, Kings D, Whiteley R, Dharman A, Taqtaq G, Mc Court P, Alkhelaifi K, Targett S, Holtzhausen L, Pieles GE, Dzendrowskyj P, Zikria BA, Bordalo M, Al Hussein I, D’Hooghe P, Al-Kuwari A, Cardinale M. Medical services at the FIFA world cup Qatar 2022. Br J Sports Med. 2023 Oct 27;58(1):42–9. doi: 10.1136/bjsports-2023-106855. Epub ahead of print. PMID: 37890964; PMCID: PMC10804010.

Bordalo M, Serner A, Yamashiro E, Al-Musa E, Djadoun MA, Al-Khelaifi K, Schumacher YO, Al-Kuwari AJ, Massey A, D’Hooghe P, Cardinale M. Imaging-detected sports injuries and imaging-guided interventions in athletes during the 2022 FIFA football (soccer) World Cup. Skeletal Radiol. 2025 Apr;54(4):819-828. doi: 10.1007/s00256-023-04451-z. Epub 2023 Sep 16. PMID: 37715819; PMCID: PMC11845536.

Bordalo M, Evans T, Allenjawi S, Targett S, Dzendrowskyj P, Al-Kuwari AJ, Cardinale M, D’Hooghe P. Management of radiology services during the 2022 FIFA football (soccer) World Cup. Skeletal Radiol. 2025 Apr;54(4):647-653. doi: 10.1007/s00256-023-04486-2. Epub 2023 Nov 9. PMID: 37943308; PMCID: PMC11845430.

Alsenoy KV, Raisi LA, Shamsi FA, Thomson A, D’Hooghe P. Service Planning and Provision During Qatar’s 2022 FIFA World Cup and 2023 AFC Asian Cup: Sports Podiatry. J Am Podiatr Med Assoc. 2025 Sep-Oct;115(5):24-176. doi: 10.7547/24-176. PMID: 41166158.

For the public, the most visible “injury data” is the running tracker — outlets such as ESPN, The Independent and others maintain live lists of who is ruled out or racing to be fit, and this tournament has tested several squads hard, with sides like Brazil and the Netherlands losing first-choice players before a ball was kicked. These are journalism rather than open datasets, but they perform a real function: a structured, continuously updated public record of availability.

FIFA has a long history of medical research around its tournaments, and the combination of tracking data (sprint loads, high-intensity distances, accelerations) with injury records is exactly the kind of linkage that could move us from counting injuries to understanding and preventing them. The performance data and the medical data are two halves of the same picture; sharing both is how we protect the players who generate it.

Why sharing the data matters

I want to close on the part I care about most, because it’s easy to treat “FIFA released some metrics” as a minor technical footnote. It isn’t.

It democratises insight. When tracking-derived data was private, the gap between the richest and poorest programmes was partly a data gap. Publishing EFI, and giving every World Cup team the same AI tools, narrows that gap. Insight stops being a function of budget alone.

It creates a shared language. When a coach in one country and an analyst in another can both point to the same definition of a line break or “in contest” possession, conversations get more precise and more productive. Common metrics are the grammar of a common discussion.

It invites scrutiny and reproducibility. The moment a method is public, people like Doğan Parlak can try to rebuild it, stress-test it, and improve it. That is exactly how a field matures — not by guarding methods, but by exposing them to challenge.

It stimulates new ways of analysing the game. This is the part that excites me as a scientist. Hand the same dataset to a hundred curious people and you will get analyses no single organisation would ever have commissioned. Open data is generative: it produces questions, tools and visualisations that wouldn’t otherwise exist, and the elite game gets smarter as a result.

Football has always been understood through stories and through the eye. What FIFA’s data initiative does is add a third lens — a transparent, shareable, contestable one — and then, remarkably, hand it to everyone. The numbers are interesting. But the decision to share them is what will change how we understand the game at the very highest level. So, well done to my FIFA colleagues for this initiative.

At Aspetar we have produced a special issue of our Journal dedicated to Football and the World Cup. You can access it by clicking on the cover page.