Month: May 2021

Should we expect a bigger home advantage in the Tokyo Olympics?

63 days to go until the opening ceremony of the most unusual Olympic Games in History. While Worldwide and in Japan there is a lot of discussion about the possibility that this edition may not go ahead after the postponement of last year, let’s discuss home advantage at the Olympics.

The COVID situation is still ‘live’ and it will be a challenge for athletes and support staff to attend with many restrictions and most of all with uncertainty over the ability for the public to access the venues. What we know is that international spectators will not be allowed to attend the games and travel to Japan which creates a unique scenario for such a global sporting event. In fact, we could have a scenario where only domestic spectators can be allowed to attend (full or limited numbers) or the current scenario in many countries at the moment where no spectators are allowed in the venues.

Either scenario will have for sure implications for the performance of athletes and may affect in particular local athletes (positively or negatively is the real question).

Historically, home nations have benefitted from the Olympics at home by winning more medals than the previous editions. In the last twenty years in particular, the trend has been quite clear with Greece and Brazil showing a minimal ‘gain’ from hosting the games and Australia, Great Britain and China making huge improvements (with GB being the only nation to surpass home games success in Rio 2016).

Difference in Medals won from previous OG in host nations.

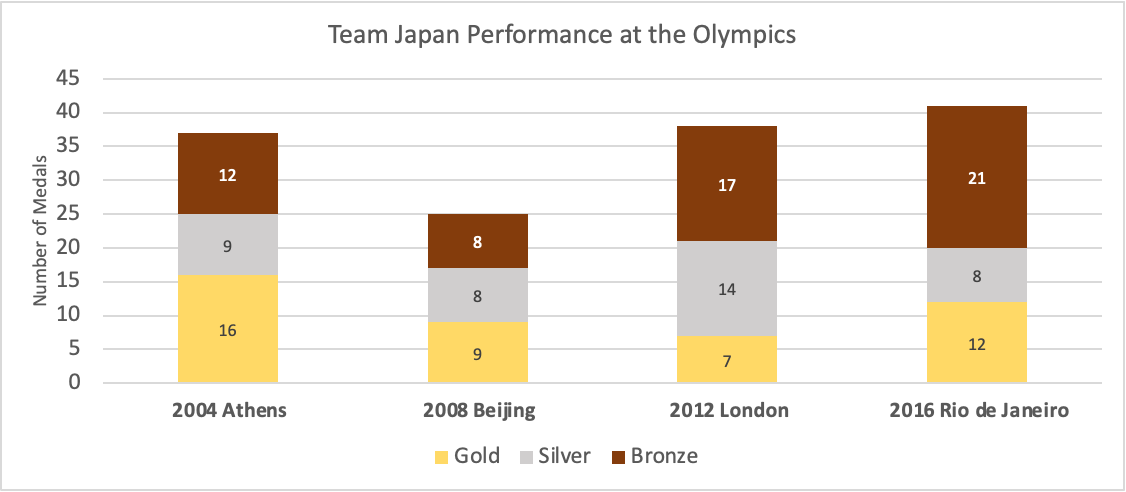
Japan as a host nation has great ambitions. The performance of Japanese athletes in the last 3 editions of the Olympic Games has shown an increase in the number of medals possibly thanks to increased investment in Olympic Sports and in infrastructure which could reach its peak at the ‘Home’ Olympics. My Japanese colleagues tell me the objective is to finish in the top 3.

Current virtual medal tables based on performances in World Championships/World Cups/Continental championships are starting to predict how the final medal table might look like and many indicate that Japan might be well on track to be in the top 4 in this edition with the fight between 1st and 2nd place between USA and China and with Team GB not looking particularly promising.

Virtual Medal Table 1-10
Virtual Medal Table by Gracenote

Another nation looking on the up is the Netherlands which has been the most improved nation in medals won in the quadrennium 2016-2020.

Biggest Medal Improvements-041421
Biggest Medal Improvements – form Gracenote

For sure, this edition of the Olympics will be unusual and incredibly challenging to predict due to the many uncertainties and challenges athletes and coaches face. Most of all, we don’t know what crowds (if any) they are going to have in the venues and this might change completely many dynamics.

I was fortunate enough to be in the Beijing, Vancouver and London venues and I can tell you that the crowds had a massive influence on many performances (Usain Bolt sprinting the World Record in Beijing, Canada beating the US in the Ice Hockey Final in Vancouver, and super saturday in London 2012). Will the Japanese athletes benefit more or less from home advantage? Will we be able to witness incredible performances?

Despite the pandemic, there have been some exceptional performances in 2020, are we going to witness something really special this time? Who are going to be the heroes and the villains?

Data and Dashboards Part 2

Following up on my previous post on sports technology I have been using and data visualisation/analysis platforms, I want to share more information about various data visualisation options I have come across recently.

Anybody involved in sport at any level is now recording some data in training and/or competition thanks to the smartwatches most people wear, mobile phones and related apps and wearable technologies such as rings and bracelets capable of recording various aspects of performance.

In recent months, the Oura ring received a lot of attention due to its implementation in the NBA bubble. The ring is capable of measuring activity, sleep and heart rate variability by means of pulse oximetry. You can read the PhD thesis of Dr Hannu Kinnunen here. I met Hannu years ago when working on a project with Polar on the RS800 and he always had some creative ideas about wearable technology and algorithm development, so I am very happy to see his product getting so much attention. I don’t wear rings, but it is definitively on my list to try it.

The other wearable receiving a lot of attention is the whoop strap. Similar technology in a bracelet format. Validation studies are starting to be published, and it seems that Whoop is reasonable in measuring sleep as compared to polysomnography. It seems to be quite accurate also in assessing heart rate and respiratory rate.

Thanks to improvements in data processing of mobile phones and quality of sensors placed in them, there has been also an increase in the development of apps capable of assessing ‘readiness’ to train by measuring heart rate variability parameters. As a long term user of the HRV4 training app, I can say that this simple tool developed by Dr Marco Altini is fantastic. Pretty accurate as indicated by validation studies and now well used in the field (see an example here and one here) it provides good quality data in a simple manner also with the possibility to monitor different athletes with the coach app. Marco has really done a great job with this app, and the data generated are useful to drive programmes also with athletes coached remotely. His latest work (the Heart Rate Variability Logger app) to estimate the aerobic threshold non-invasively has been recently featured in the British Journal of Sports Medicine. I have not downloaded this app yet, but will do soon as I plan to run more and want to use the data to drive my program, hoping that the calf muscles behave.

I have tracked morning Heart Rate data for a number of years now, and can say that for me it is a way to track training and non training stress very well. Alterations in morning Heart Rate and HRV indices are affected by many factors, however form my own personal experience, I know that when HR is high and RMSSD is low, there is something brewing and I need to put the foot off the pedal. In 2017, Xiao Li and her colleagues at the Snyder Lab at Stanford University published a paper showing that tracking heart rate among other physiological signals in daily life can give warning of sickness onset. It’s a great paper, based on a careful examination of data from over 250,000 daily measurements among 43 people. Fascinating paper which shows how, thanks to technology, we are moving towards the ability to be able to truly personalise health and training interventions also form remote by having relevant data to use. There are now a number of studies recruiting individuals worldwide to share their wearable data to understand more about flu and COVID-19 symptoms. One of them is here https://quantifiedflu.org and it is using data from a number of wearable technology. If you are interested, have a look at the page and take part!

On a personal level I am very interested in using my scientific training to answer personal questions, and I really like this framework recently proposed by Gary Wolf and Martijn De Groot which was based on a previous attempt by Li et al. more than 10 years ago (see picture below).

A Stage-Based Model of Personal Informatics Systems by Ian Li, Anind Dey, and Jodi Forlizzi

As indicated in my previous post, one of the challenges to the use of multiple technology platforms is the ability to put all the data in the same place and be able to visualise them to make inferences. I have shared some examples before, but what is truly missing is the ability to simply visualise everything you measure without using time consuming processes involving downloading of data in .csv format and/or complex API connections, hours of R-coding and expertise in various domains. Thankfully, there are some free solutions appearing which are promising and can provide simple ways to integrate data.

The first one I want to talk about is the Habit Dashboard. This personal health analytics platform integrates data from multiple apps and allows the user to access a comprehensive view. Both the graphic and tabular formats are good and data streams sync very easily.

There are also alternatives like building your own dashboard with Google (see how to import Strava data in Google forms here), Grafana (link here) and Power BI (link here).

Last but not least, an excellent tool developed by John Peters in collaboration with Prof. Stephen Seiler to be able to analyse endurance training sessions and competitions. EnDuRA (Endurance Durability and Repeatability Analyser) can be found at http://endura.fit and you can import Garmin data (FIT and TCX format activity files either as .FIT.TCX.FIT.GZ). And if you want to read more about the concept of ‘Durability’, this recent review is a must read for anybody working with endurance athletes.